RiverNET Water Quality Monitoring
click the links below to view, explore, and download the data, and remember:
These data are provisional and subject to revision, and may be inaccurate due to equipment malfunctions and other issues, so should be used with caution until they are independently reviewed and finally approved. Users are cautioned to use these provisional data carefully before decisions that affect personal or public safety or business operations are made. Contact Patrick Cross for more information on the quality control measures and review processes.
So what exactly am I looking at here?
We’ve designed the following data plots to:
Show the results of our in-house water quality analysis through colored bar charts. Read these using the scale on the left side of the plot (Y-axis) as you would an old fashion mercury thermometer: as the value increases, so does the height of the bar. The plots are further arranged so that the data can be visually assessed and compared in a meaningful and relevant way:
Each parameter is plotted individually (named in the plot title), each bar represents a single sample site (described in the plot legend), and each group of bars represents a single sampling event (labeled by date on the plot’s bottom (X) axis). The scales on the Y-axis are fixed for each parameter based on the range of values observed across the entire dataset: that way, data from different sample sites/sampling events can be visually compared.
Sample sites are further grouped and arranged by geography:
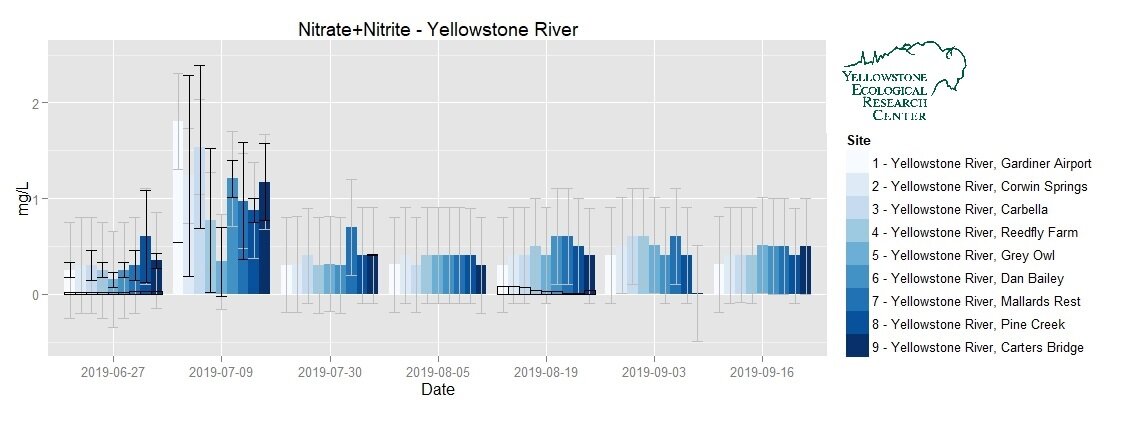
all of the Yellowstone River main stem sites are grouped together, are ordered from upstream to downstream, and share a continuous blue color spectrum because these sites and their order are related being on the same body of water
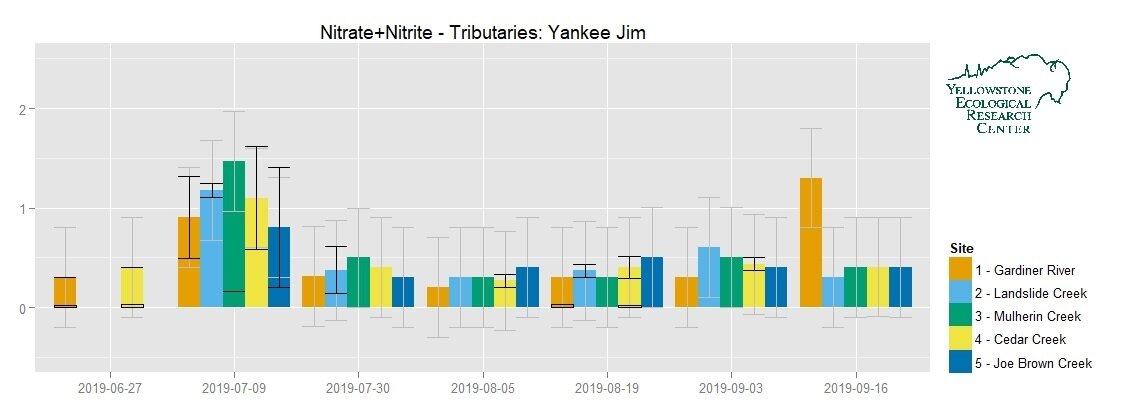
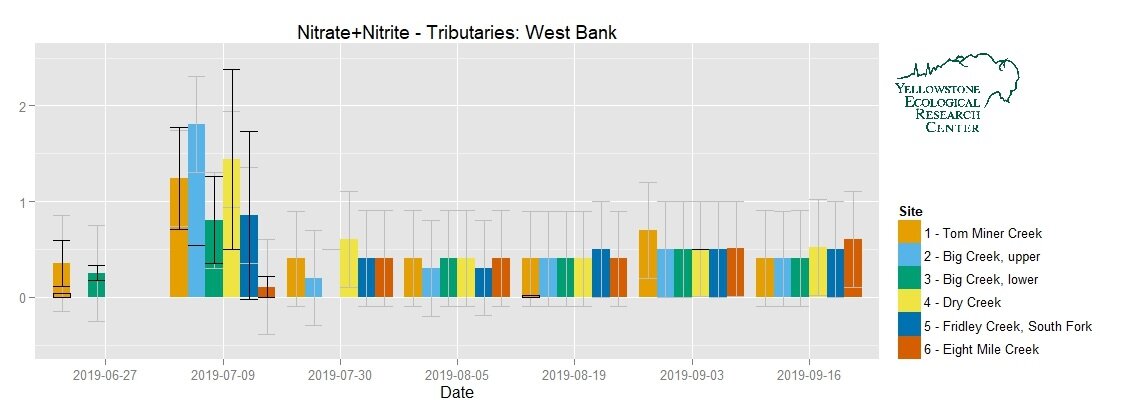
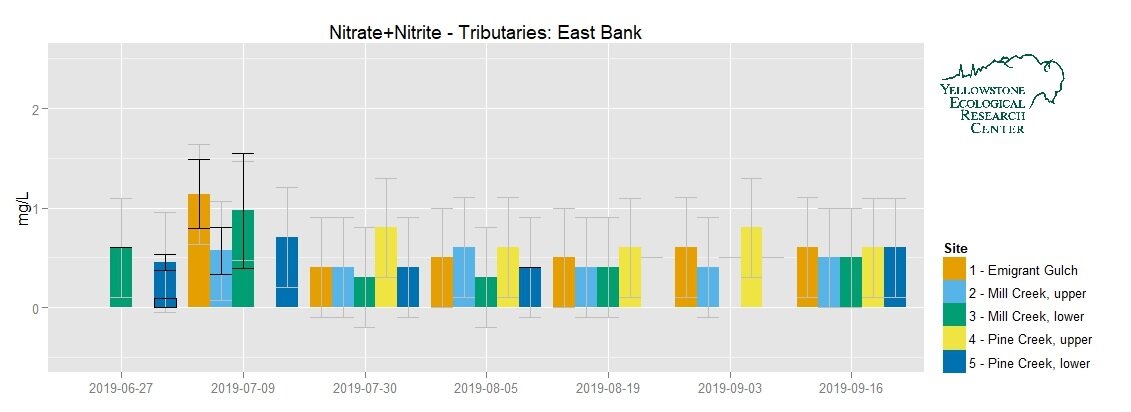
all of the tributary sites are grouped based on similar geography, ordered from upstream to downstream relative to the Yellowstone River, but DO NOT share a continuous color spectrum because each tributary is independent of the others
In addition to the colored bar charts, we also display data from our quality control/quality assurance assessments:
gray lines on each colored bar show the analysis equipment manufacturer’s reported accuracy range — the reported value shown by the colored bar could’ve actually fallen anywhere within the gray lines
black lines shown on some colored bars show the confidence interval we calculated for those results after randomly selecting two samples per sampling event, splitting the samples, repeating the analyses three times for each, and calculating the resulting averages and standard deviations — if we were to repeat the analysis a fourth time, we would be 95% confident that the result would fall within these black lines, based on the variance within the previous analyses
clear bars with black outlines overlaying some of the colored bars show independent lab results from an EPA-certified lab (Energy Labs in Helena) that we use to validate and calibrate data from our less sensitive in-house analysis equipment — these values should match up with our values, and if they don’t, then further review is needed
So to interpret these QA/QC assessments:
HIGH QUALITY: samples for which the top of the colored bar, the black lines (if available), and the top of the clear bar (if available) all fall within the gray lines are accurate and precise
MODERATE QUALITY: samples for which the top of the colored bar and the top of the clear bar, but not the black lines, are within the gray lines are accurate but not precise
LOW QUALITY (1): samples for which the top of the colored bar and the black lines, but not the top of the clear bar, are within the gray lines are precise but not accurate
LOW QUALITY (2): samples for which neither the black lines nor the clear bar are within the gray lines can be considered neither accurate nor precise
UNKNOWN QUALITY (1): samples with no confidence interval, but that do have a clear bar within the gray lines, are accurate with unknown precision
UNKNOWN QUALITY (2): samples with no independent lab results, but that do have a black lines within the gray lines, are precise with unknown accuracy
UNKNOWN QUALITY (3): samples with neither confidence intervals nor independent lab results have unknown accuracy and precision
Not all of the samples have a confidence interval: we randomly select ~10% of the sample sites on a given sampling event to conduct these analyses, as conducting them for every sample would be cost and time prohibitive. Nor, for the same reason, do we have independent lab results for every sample: we collect duplicate samples for all of our Yellowstone River main stem sites and all of our top priority tributary sites during three seasonally significant sampling events (pre-growing season; growing season; post-growing season).
Nor is there necessarily a sample for every sample site, every sampling event: although rare, some sites might not have been sampled because of access, weather, timing, or other issues, and later in the season, some tributary sites go dry. In other cases, the sample might have been collected, but a problem during analysis resulted in no available (NA) data.
But these NAs should not be confused with zeros: a site with no colored bar and without grey lines indicates that no data is available (NA) for whatever reason, whereas a site with no colored bar but with grey accuracy lines indicates that the sample was collected, the analysis was completed, and the result was zero.
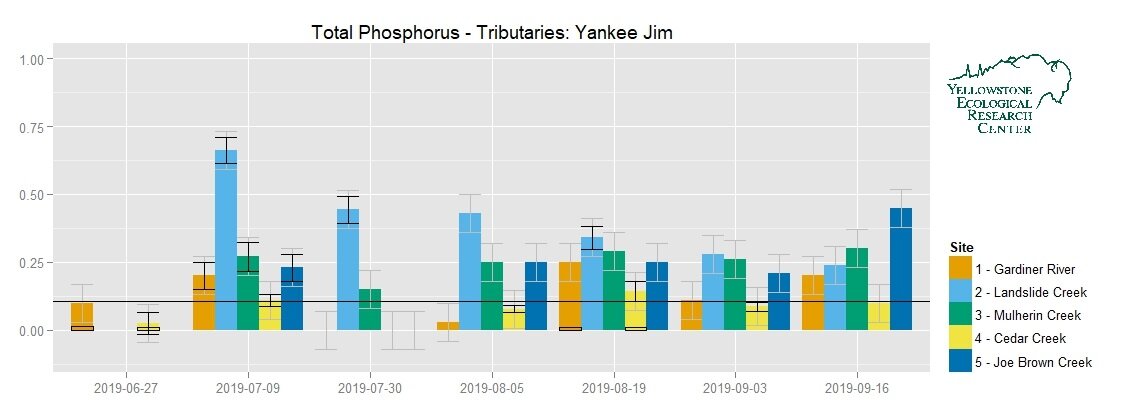
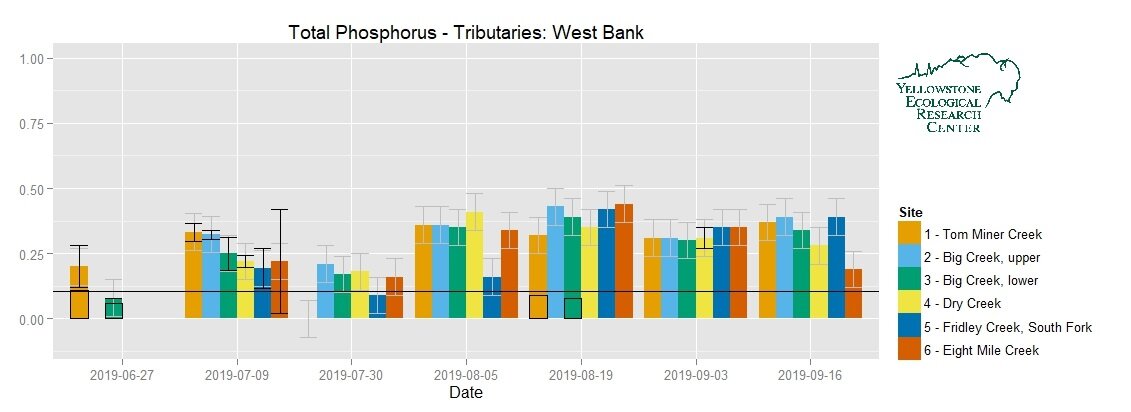
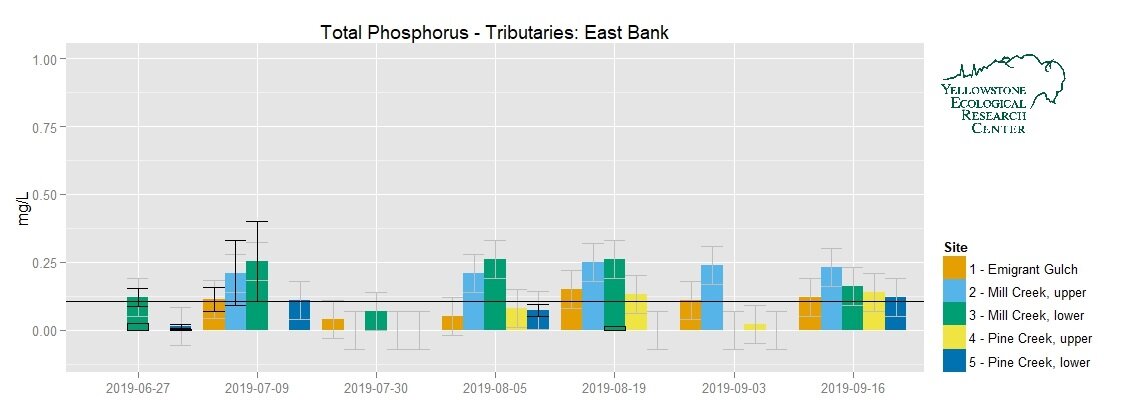
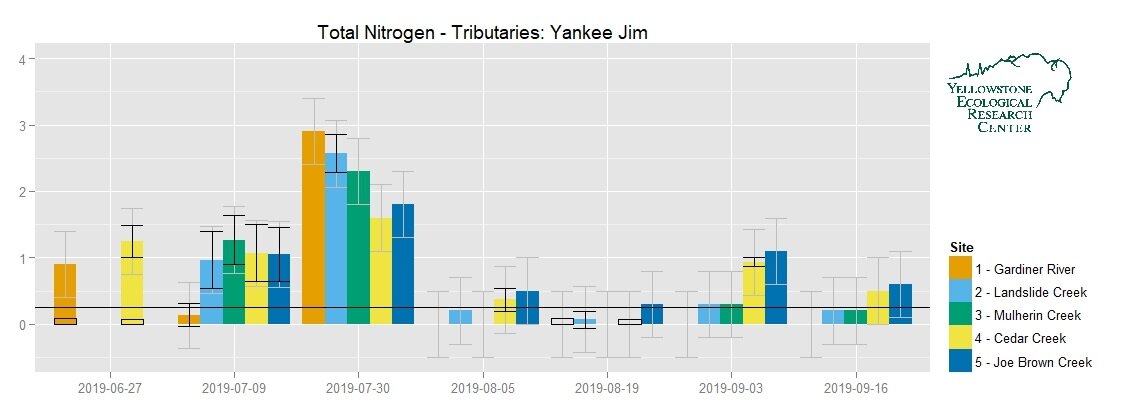
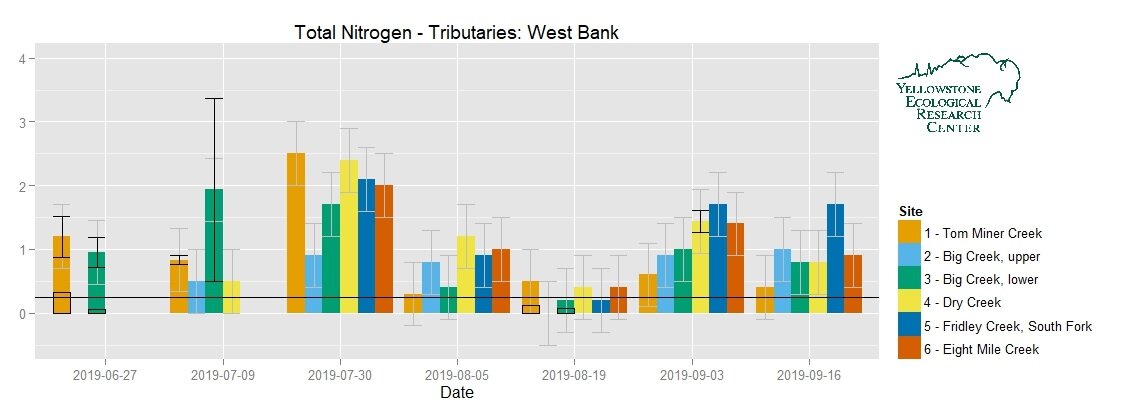
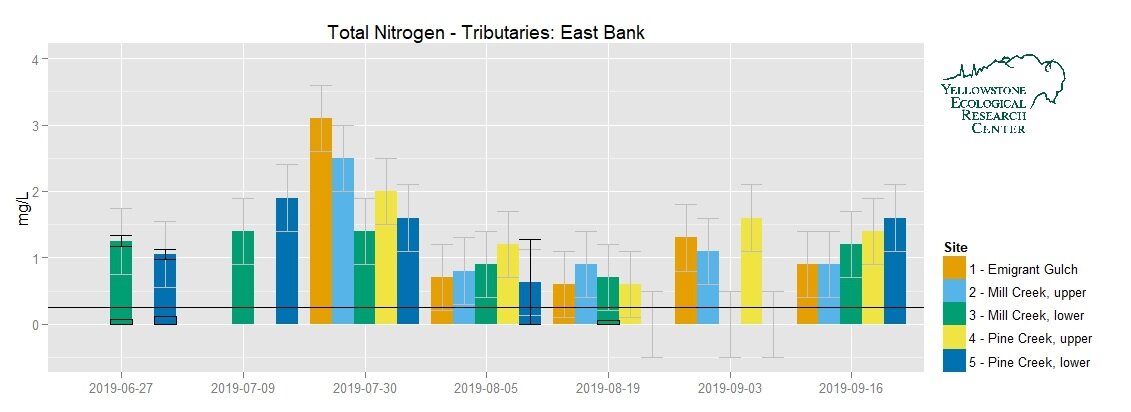
In addition to data, our Total Nitrogen and Total Phosphorus plots for tributaries of the Upper Yellowstone also show horizontal lines indicating the Montana Department of Environmental Quality’s “Base Numeric Nutrient Standard” — a water quality threshold indicating the recommended maximum value for the growing season (July 1 - September 30). This threshold only applies to tributaries, and only during the growing season.
Please contact us with questions or suggestions on data visualization. Also, check out our “Field Notes” for jargon-free interpretation of what we are seeing in these data. And please remember that:
These data are provisional and subject to revision, and may be inaccurate due to equipment malfunctions and other issues, so should be used with caution until they are independently reviewed and finally approved. Users are cautioned to use these provisional data carefully before decisions that affect personal or public safety or business operations are made. Contact Patrick Cross for more information on the quality control measures and review processes.
You can also follow the links below to view the data through a customizable visualization platform, or download the data and create your own plots:
Water Quality data, by parameter:
Nitrate + Nitrite
Essential nutrients for plant growth, Nitrate and Nitrite are produced in the soil during a process when atmospheric nitrogen is converted into a form that plants can use. Contamination from sewage, manure, and/or fertilizer in drinking water can have human health effects, and cause excessive plant growth in surface water leading to eutrophication. DEQ monitors public water systems in Montana for nitrates: concentrations greater than 10 mg/L exceed the Maximum Contaminant Level and would require immediate remediation, while concentrations of 0-2 mg/L are normal, background levels indicative of high water quality. Additional local background data comes from a 1999-2001 USGS survey of monthly water samples collected across the Yellowstone River basin, including from a site at Corwin Springs where nitrate values ranged from 0-0.38 mg/L, with a median of 0.1 mg/L. Although nitrate+nitrite levels are generally low in the Upper Yellowstone, monitoring can help identify local sources of contamination before they spread.
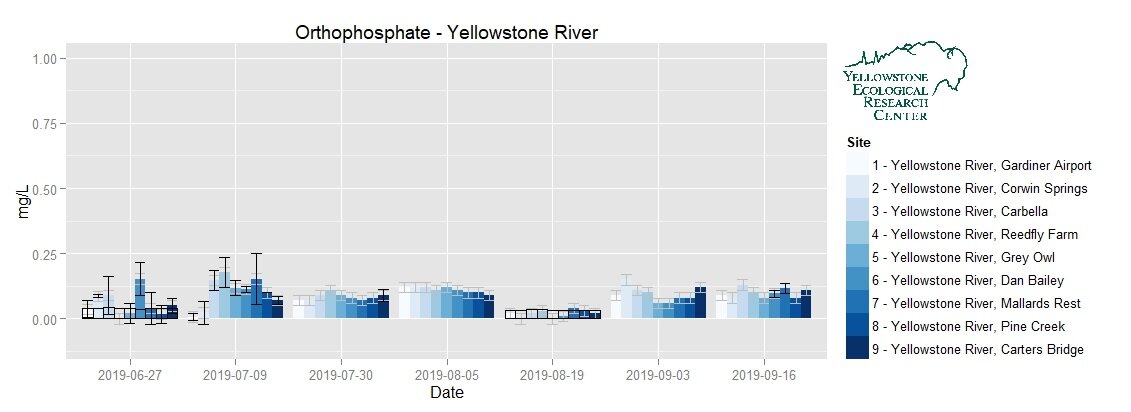
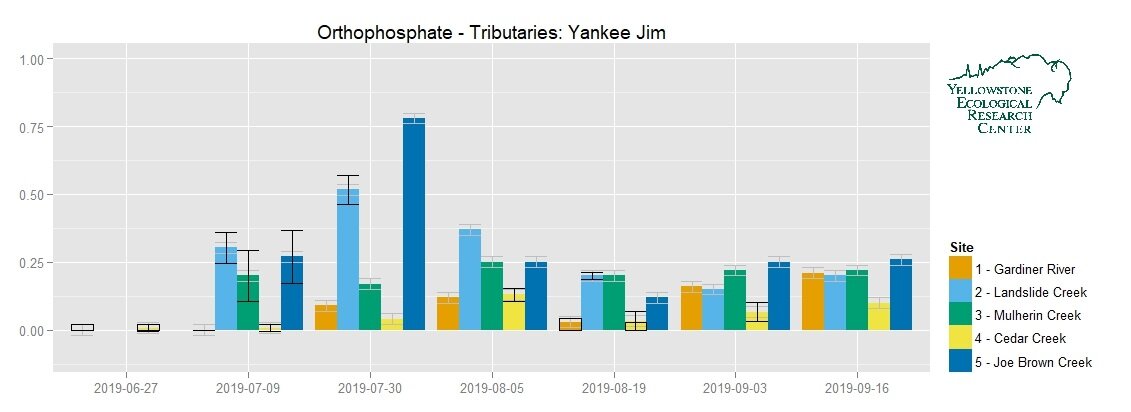
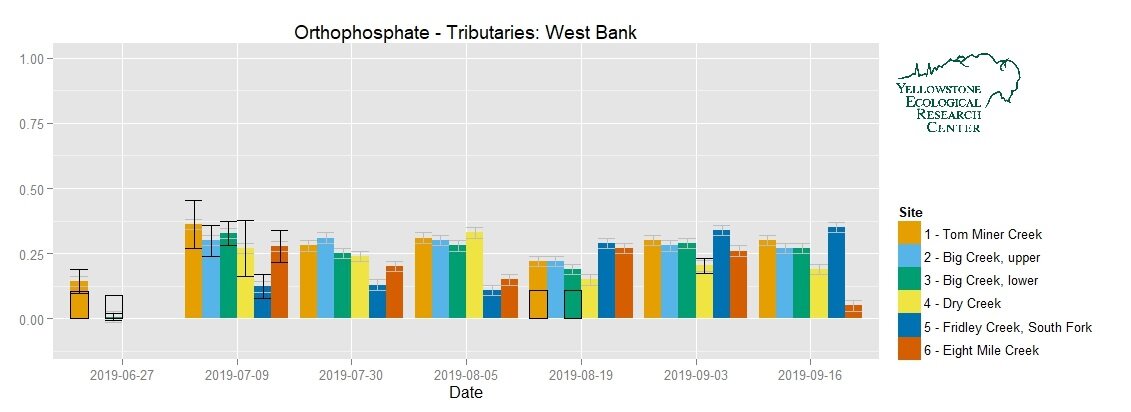
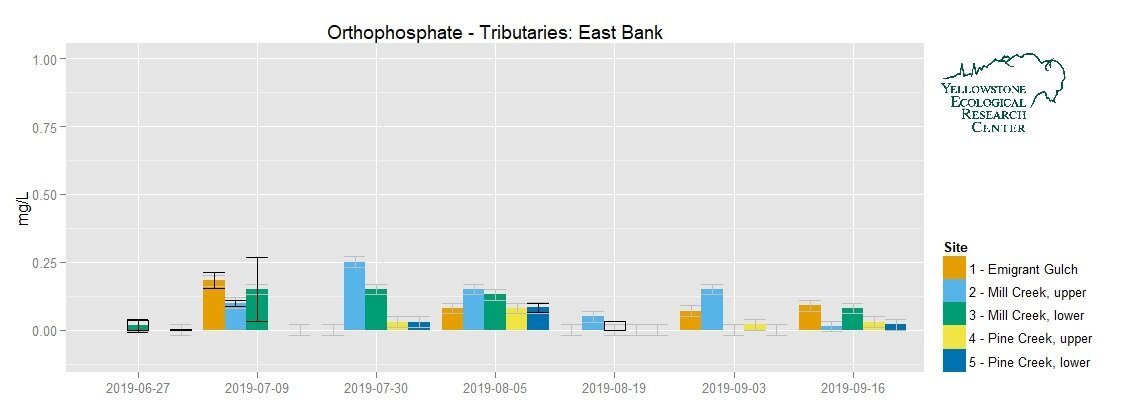
Orthophosphate
Plants and algae are able to use this form of phosphorus, so monitoring allows us to specifically measure how much of this nutrient is available for plant growth. It is also a main component of fertilizers, so comparisons with other nutrient levels can help distinguish this potential source from others. Although DEQ does not specifically monitor for Orthophosphate in Montana, it is a parameter that our in-house analysis equipment can assess with greater sensitivity and accuracy, and through a cheaper and simpler process, than Total Phosphorus. It may therefore serve as a useful substitute for Total Phosphorus in a sustainable, long-term monitoring program.
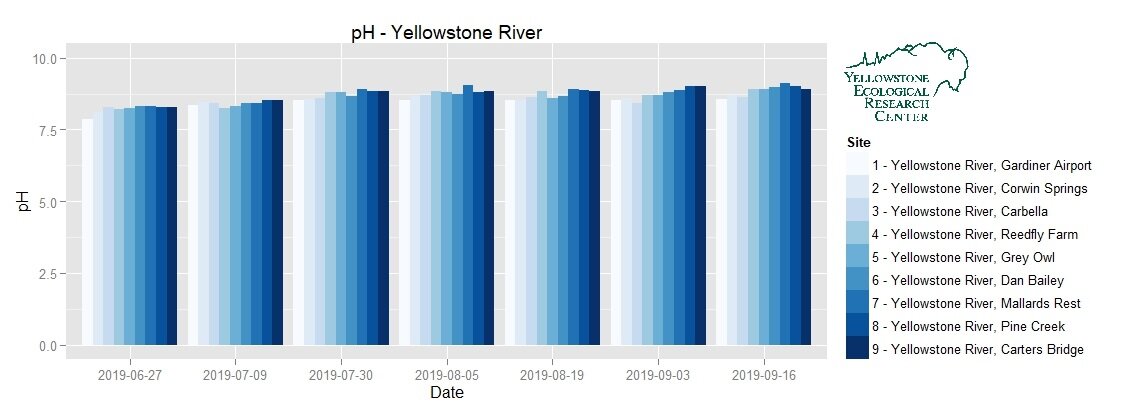
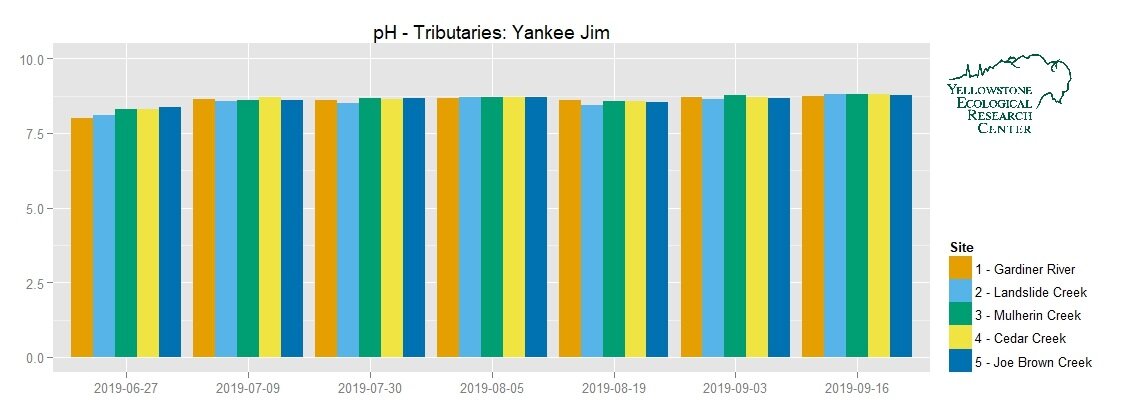
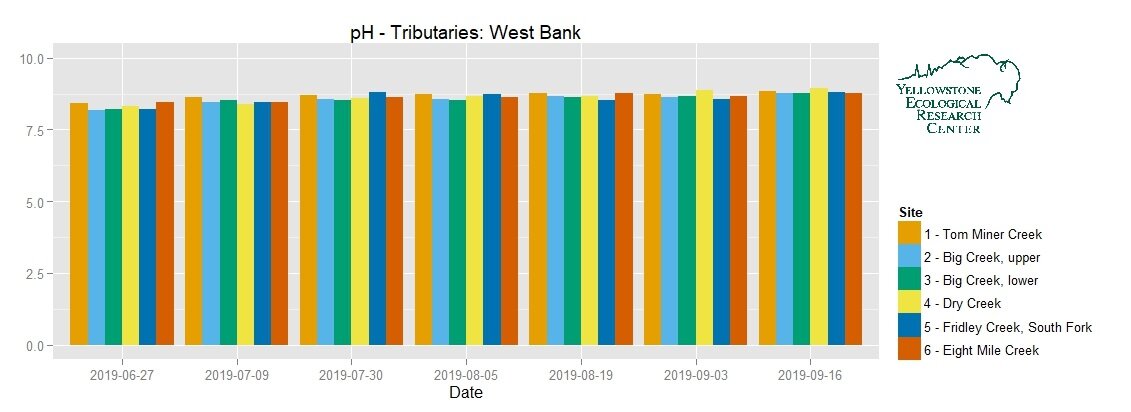
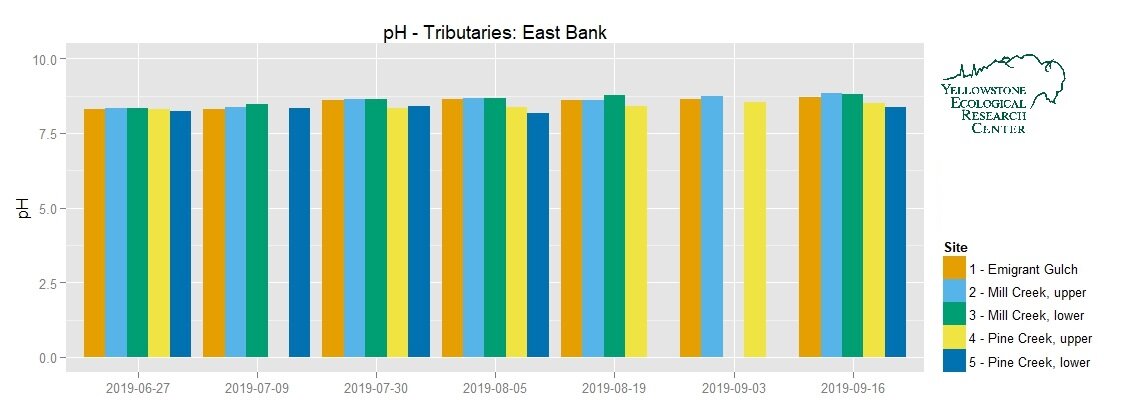
pH
pH is a measure of acidity, with lower values indicating greater acidity: vinegar = 2.5 pH, pure drinking water = 7 pH, baking soda = 9 pH. With surface water, geology and the natural environment have a major influence on background pH levels: in the Upper Yellowstone River Watershed, the pH is naturally a bit higher than drinking water typically is, around 8 pH. Pollutants can affect pH, which in turn can affect the toxicity of nutrients like ammonia as well as certain metals through chemical reactions that make them easier for plant and animal cells to absorb. Its impact on a variety of water quality processes, and its relative ease of recording, make pH a valuable parameter for water quality monitoring.
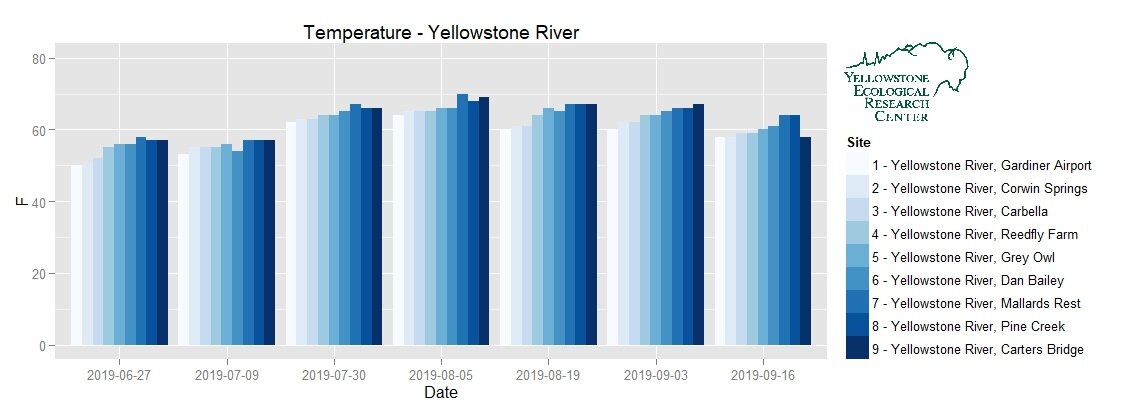
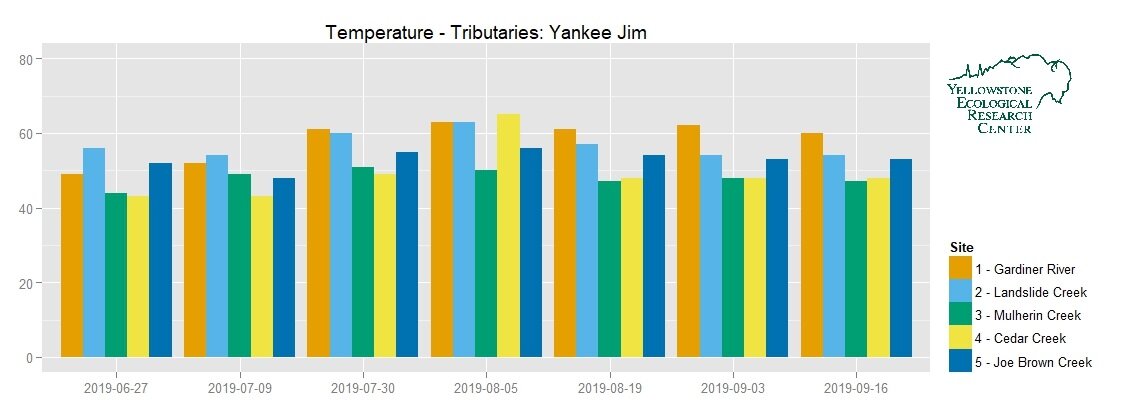
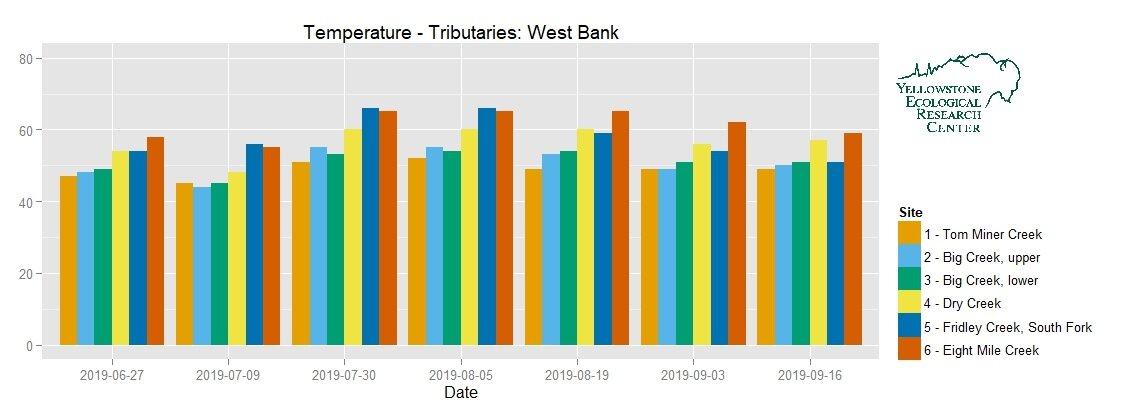
Temperature
Water temperature can affect the concentration of and chemical reactions between various nutrients and metals, and can also be an indicator of habitat quality in itself. Trout typically feed in water temperatures between 45 and 65 degrees Fahrenheit, whereas Montana FWP typically implements “hoot owl” fishing closures when water temperatures stay in the 70s Fahrenheit for multiple consecutive days. Dangerously high temperatures can be mitigated by increasing flows and planting riparian vegetation to provide more shade. We are monitoring water temperature in two ways: by recording the temperature at the surface when we collect water quality samples (here), which is influenced by the time of day when the sample was collected, and with thermometers attached to our water quantity sensors that are collecting data near the bottom of the stream every hour.

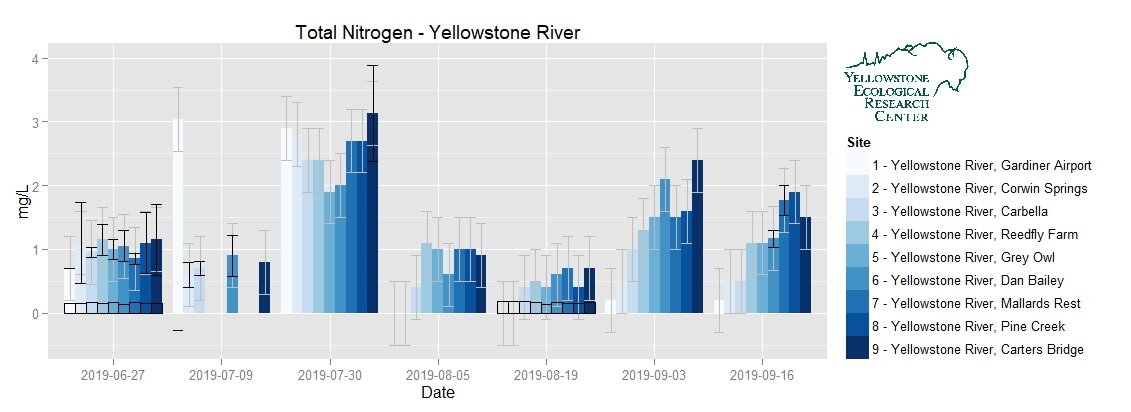
Total Nitrogen
The sum of all nitrogen compounds, natural and anthropogenic, detected in the water sample. We can estimate the concentration of ammonia by subtracting Nitrate and Nitrite from Total Nitrogen. Ammonia can be particularly toxic for aquatic life, and its primary source is fertilizer run off while there are other human sources like sewage and natural sources like soil and erosion from forest fires. Total Nitrogen in Montana surface water is also monitored by DEQ as part of its Base Numeric Nutrient Standards that, along with Total Phosphorus, set levels for these two primary nutrients associated with most water pollution sources and water impairment issues in Montana. The maximum allowable Total Nitrogen concentration is 0.25 mg/L for wadable streams (i.e., tributaries) during summer baseflow (July 1-September 30). Data for the Yellowstone River at Corwin Springs from the 1991-2001 USGS study found Total Nitrogen values ranging from 0.2-0.9 mg/L, with a median of 0.35 mg/L.
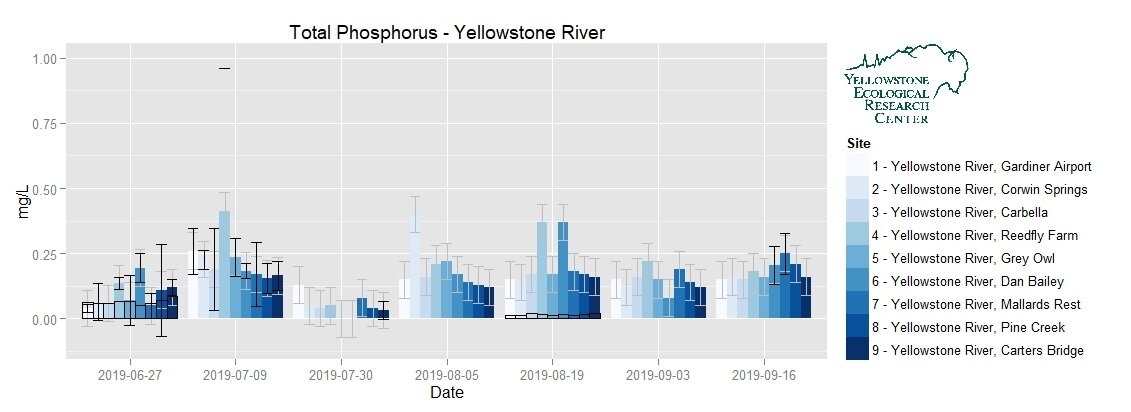
Total Phosphorus
Like with nitrogen, phosphorus compounds are essential nutrients for plant growth and animal nutrition, but excess concentrations in water from sewage, manure, and fertilizer runoff as well as soil erosion can lead to excess plant growth. When those plants die, the decomposing bacteria use up all the dissolved oxygen, killing other aquatic life in the process of eutrophication. Household detergents can be another major source of phosphorus contamination. And like Total Nitrogen, Total Phosphorus in Montana surface water is monitored by DEQ for base numeric nutrient standards, with a maximum allowable concentration of 0.105 mg/L in wadable streams during summer baseflow (July 1-September 30). Owing to the volcanic soil in much (but not all) of the Upper Yellowstone River watershed, this base numeric nutrient standard is more than three times greater than it is for the rest of the region. Data for the Yellowstone River at Corwin Springs from the 1991-2001 USGS study found Total Phosphorus values ranging from 0.015-0.5 mg/L, with a median of 0.025 mg/L.