Estimating Plant Production Using Satellites
Yellowstone Ecological Research Center geospatial scientist recently published a peer-reviewed manuscript in the journal of Carbon Balance and Management titled "Evaluation of modeled net primary production using MODIS and landsat satellite data fusion". YERC staff developed a novel technique to combine information from different satellite sensors to improve our estimates of ecosystem productivity.
We expanded on an existing ecosystem model called the Carnegie-Ames-Stanford-Approach (CASA) ecosystem model developed by co-author and affiliate scientist, Christopher Potter. Using high resolution LandSat data to classify ecosystems and medium resolution MODIS data to acquire vegetation information we were able to improve net primary productivity estimates in certain landscapes.
So, what is Net Primary Productivity?
NPP is the total accumulation of carbon by plants minus the amount of carbon lost by plants. Plants capture solar energy and convert it into nutrients which then drives most biotic processes on Earth. Therefore, understanding climate change's effect on NPP are an issue of central relevance to humanity, in part due to possible limitations on the extent to which NPP in managed ecosystems can provide adequate food and fiber for growing populations.
Measurement of NPP presents many challenges in any ecosystem, and particularly in heterogeneous environments such as wetland, cultivated, ex-urban, and mountainous landscapes. Traditionally, NPP has been calculated by harvesting and measuring dry biomass or from eddy flux towers estimates. Measuring dry biomass is labor- and time-intensive and logistically impossible to perform at scales other than the small plot. Eddy flux towers measure the amount of CO2 being exchanged with the atmosphere across a landscape. This technique can cover a larger area than using small plot biomass measurements. However, eddy flux tower measurements are affected by wind direction and atmospheric conditions, and logistical limitations have led to under-representation of tower sites in remote, disturbed, or degraded ecosystems.
In this manuscript we describe how we have developed a new approach to improve the spatial resolution and potentially the accuracy of the CASA NPP model by using an image fusion technique, whereby high resolution, Landsat-derived land cover is fused with MODIS MOD13A1 Enhanced Vegetation Index (EVI) data. The proportion of each land cover type within each pixel area was used to influence the ecosystem model result. This technique produced CASA model predictions of monthly NPP at 0.004 degree (approx. 500-meter) resolution for North America from 2000-2010 that were compared to tower flux estimates of NPP for evaluation.
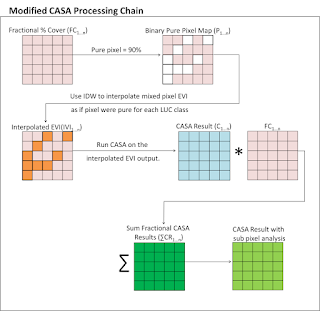
Processing steps for the modified CASA algorithm. 1) Identify 500-m MODIS pixels containing >90% cover of the same NLCD land cover class. 2) Using pure-pixels identified in step 1 as points, interpolate (IDW) mixed pixel EVI values as if the interpolated cell were pure for each cover class. 3) Run CASA for all cover types using the corresponding pure-pixel interpolated EVI raster developed in step two. 4) Multiply the CASA outputs by the fractional % cover raster. 5) Sum the outputs from step 4.
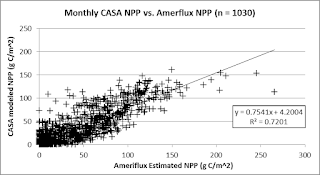
We evaluated seventeen Ameriflux towers spread across the Continental United States (CONUS) were combined to evaluate monthly NPP estimates from the modified CASA model. Using a NPP:GPP ratio of 40% in the tower flux measurements, 1030 monthly data values plotted against the CASA model outputs resulted in an overall R2 of 0.72. Averaging NPP for a three cell by three cell buffer around the flux tower location resulted in a slight decrease in correlation between modeled NPP and flux tower measurements (R2 = 0.71). Removing flux tower sites that have been recently disturbed or managed the overall R2 increases to 0.82. The revised CASA monthly NPP estimates were found to be 25% lower overall than the tower-based NPP measurements, for reasons explained below.
On a seasonal basis, the modified CASA model most closely matched the tower flux NPP during summer (R2 = 0.58) and autumn (R2 = 0.72), and most poorly in the winter (R2 = 0.22). Correlations were also relatively low in the spring, showing a R2 = 0.48. Tower sites in the Northeast and northern Midwest showed the highest levels of correlation (Table 2), with the Sylvania Wilderness flux tower in northern Michigan returning a R2 = 0.93 and the Morgan Monroe State Forest flux tower in Indiana a correlation of R2 = 0.93. Southern and western CONUS tower sites matched most poorly with CASA model estimates, with the Donaldson flux tower in Florida showing the lowest correlation of R2 = 0.01 and the ARM-SGP main tower in Oklahoma returning an R2 = 0.08. When grouped by land cover types, the combination of deciduous broadleaf forests monthly NPP measurements matched most closely with CASA model estimates, resulting a correlation of R2 = 0.88, followed by croplands (R2 = 0.73), grasslands (R2 = 0.65), and evergreen needleleaf forests (R2 = 0.57).
To learn more, read our manuscript here.


